Every time news comes out about yet another report on how much the planet is suffering from pollution and how climate change is getting worse by the minute, instead of thinking “we’re screwed,” we should probably turn that into positive thinking and start considering what we can do to stop it.
Well, consider this an exercise in positive thinking, as NASA has just come out with a video showcasing the history of temperature increase over the past 140 years, and things aren’t looking so good as last year has been declared the hottest in history, tied for first place with 2016.
As if 2020 wasn’t bad enough, NASA dropped some sad news about the alarming temperature levels
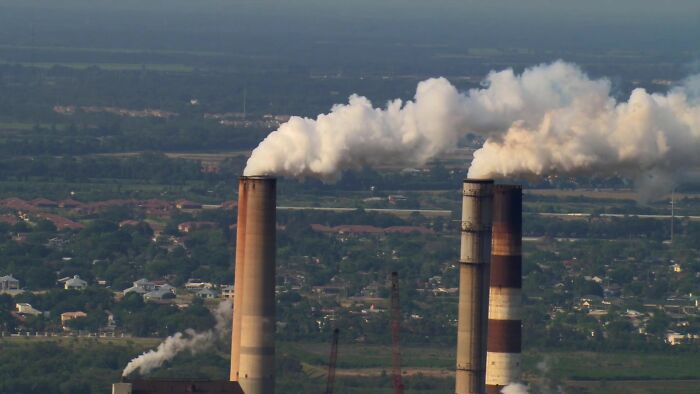
Image credits: NASA Goddard
So, the National Aeronautics and Space Administration, more commonly known as NASA, just released a video announcing that, in 2020, the average surface temperature tied with 2016 as the warmest year on record.
According to scientists at NASA’s Goddard Institute for Space Studies (GISS) in New York, the planet’s globally averaged temperature was warmer by 1.84 degrees Fahrenheit, or 1.02 degrees Celsius, than the baseline 1951-1980 mean.
Turns out, 2020 is a hot as 2016 was, and 2016 was a record-high in history
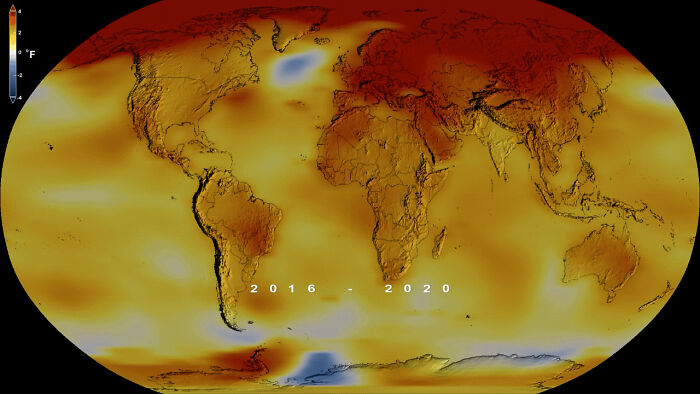
Image credits: NASA Goddard
Comparing to 140 years ago, things were drastically different regarding average surface temperatures
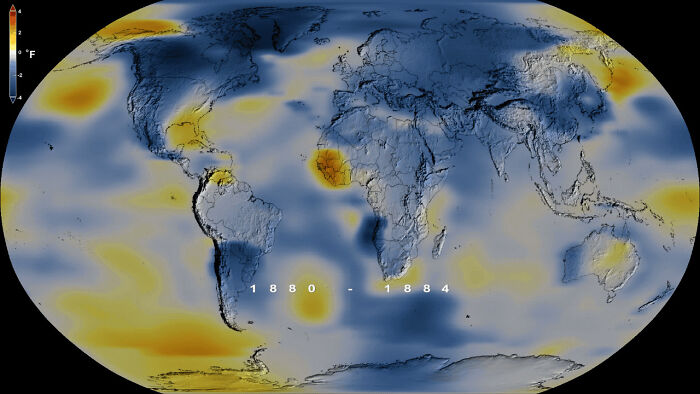
Image credits: NASA Goddard
Turns out, 2020’s average temperature exceeded 2016’s average by a tiny amount that’s considered a margin of error of the analysis, effectively making it tied for the warmest year in the last 140 years.
The ever-increasing temperatures are due to rising greenhouse gas levels caused by various human activities, including the burning of fossil fuels.
In a NASA press release, GISS Director Gavin Schmidt said: “The last seven years have been the warmest seven years on record, typifying the ongoing and dramatic warming trend. Whether one year is a record or not is not really that important—the important things are long-term trends. With these trends, and as the human impact on the climate increases, we have to expect that records will continue to be broken.”
The biggest cause of the increasing temperature is human activity, specifically greenhouse gasses
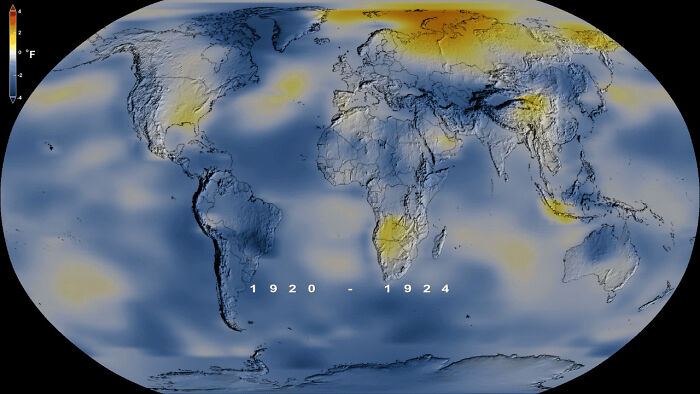
Image credits: NASA Goddard
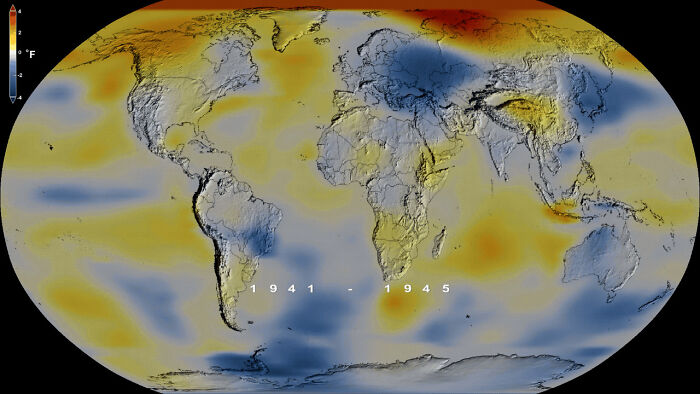
Image credits: NASA Goddard
Tracking the global temperature trends allows us to track a critical indicator of the impact of human activity, namely greenhouse gas emissions. This in turn means loss of sea ice and ice sheet mass, sea level rise, longer and more intense heat waves, more intense natural phenomena, changes in habitats, and so on.
NASA also has an ongoing project called Images Of Change, which highlights the major changes that are happening on Earth. Sad to say, many of these changes are due to human impact and climate change, like extreme lake droughts, glacier melting, and deforestation. Bored Panda has a list of the most shocking images from the series here.
There was a temporary decrease in average temperature following WWII, things started to get real bad in the 1990s
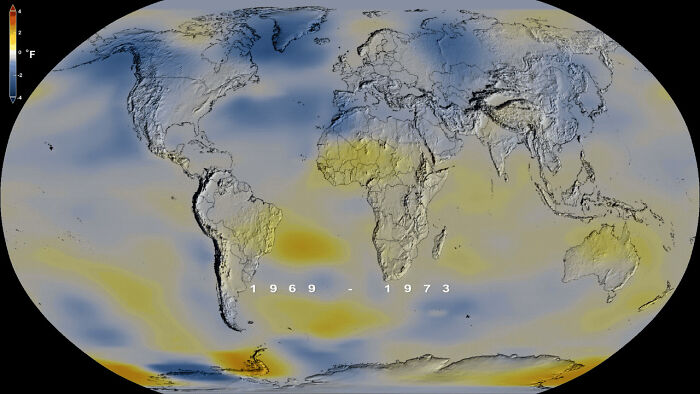
Image credits: NASA Goddard
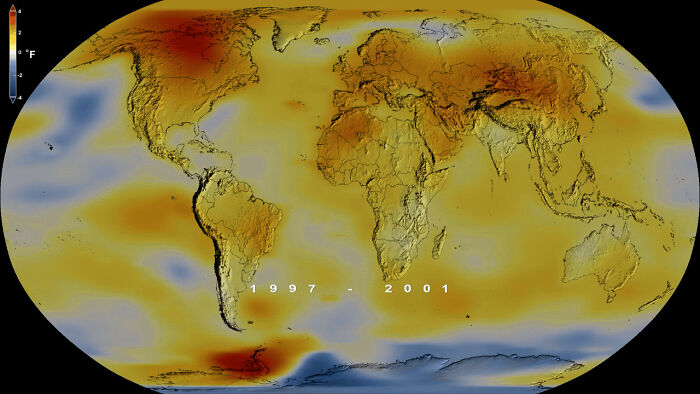
Image credits: NASA Goddard
As it stands now, the average sea level rise is predicted to be up to almost one foot (or 30 centimeters) by 2065 and up to two feet by the end of the century. Even if emissions are fully eliminated, there will still be inertia and many aspects of climate change will persist.
Check out the video NASA released showcasing the change in temperature
Image credits: NASA Goddard
Increasing temperatures also mean more intense natural disasters like hurricanes and wildfires
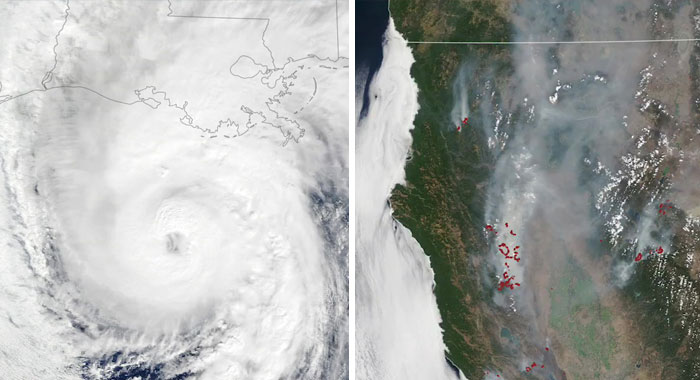
Image credits: NASA Goddard
But all is not lost, as there are numerous initiatives and campaigns in helping reduce greenhouse gas volumes. But if you want to start off small, we have a handy-dandy list of the small ways each and every one of us can help the planet, so be sure to check that one out too.
Here are some graphs for the nerdier demographic
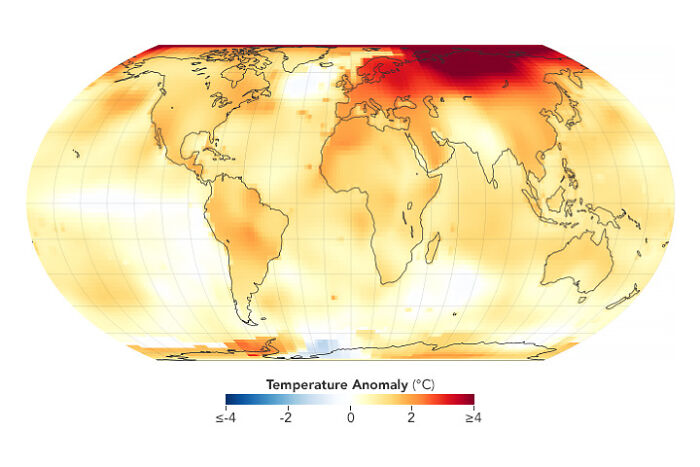
Image credits: NASA Goddard Institute for Space Studies/Gavin Schmidt
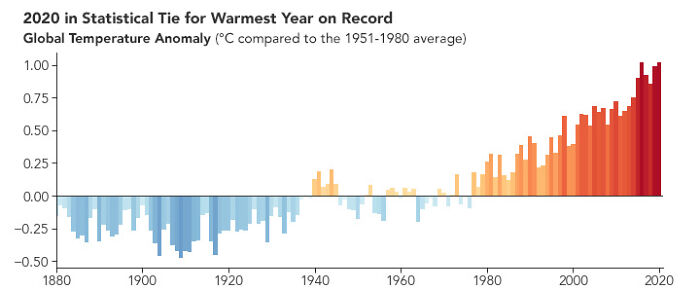
Image credits: NASA Goddard Institute for Space Studies/Gavin Schmidt
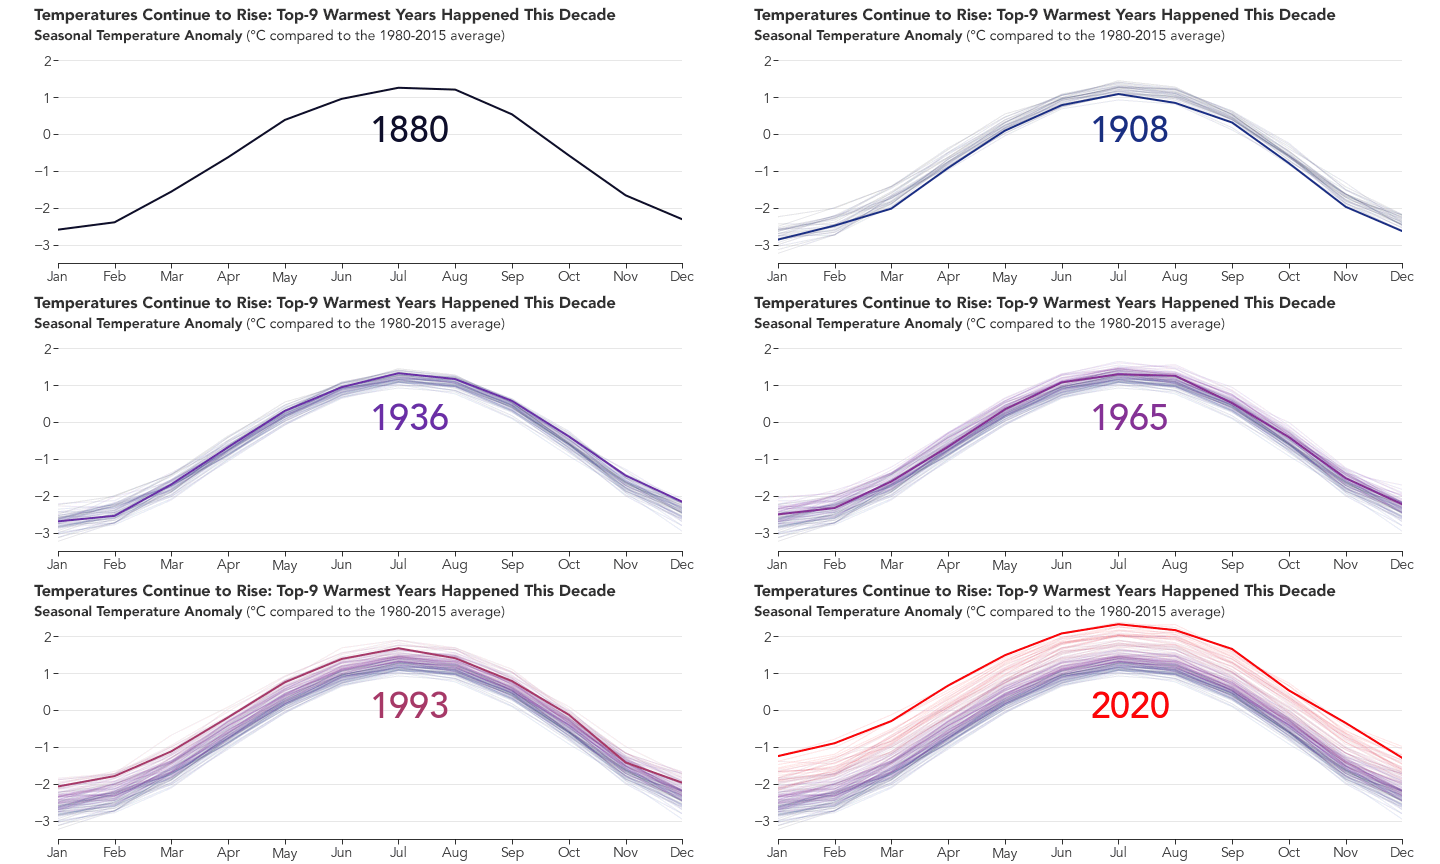
Image credits: NASA Goddard Institute for Space Studies/Gavin Schmidt
But before you go, let us know what you think of this in the comment section below!
The post NASA Releases Heat Map Video Showing How 2020 Tied With 2016 In Being The Hottest Year On Record first appeared on Bored Panda.
from Bored Panda https://bit.ly/38Izvd4
via Boredpanda